Case Study: Enhancing User Engagement with GA4 User Behavior
Current Profile:
- Company: E-Commerce Paradise
- Industry:
- Report Type: User Monthly Overview Report
- Report Purpose: The Purpose of this report is to provide a monthly overview of user related metrics and insights for this organization
- Goal: Improve user engagement and conversion on their e-commerce website..

Challenges:
E-Commerce Paradise faced challenges in understanding user behavior on their website and optimizing it for higher conversions. They needed to dig deeper into user actions and engagement to make informed decisions.
Dashboard Contents: For user overview Looker Studio dashboard use various widgets and visualizations that provide insights info user activity, engagement and other relevant metrics. These include score cards, charts, tables and other graphical representations of data. Below are the general steps to create a Looker Studio user monthly overview report.
Dashboard Contents: For user overview Looker Studio dashboard use various widgets and visualizations that provide insights info user activity,engagement and other relevant metrics. These include score cards, charts, tables and other graphical representations of data. Below are the general steps to create a Looker Studio user monthly overview report.
Step 1
Access and Data Source Connect: Log in to Looker Studio account and connect with GA4 account for data source.
Step 2
Dashboard Template Design:
Create dashboard combines multiple reports into one view. Customize the layout, colors and styling to match company’s branding. Arrange the reports on the dashboard in a logical and visually appealing way. Add controller and set up filters on the dashboard to allow users to select the month or other relevant filters. These controller will enable users to interact with the data on the dashboard.

Step 3
Key Performance Indicators (KPIs):
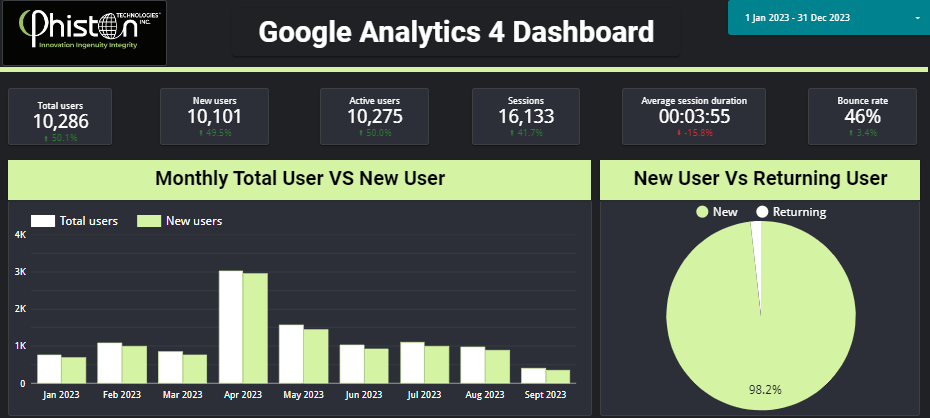
- Total Users: Measures the overall count of users for the month.
- New Users: Counts the number of first-time users.
- Active Users: Counts the number of unique users that engage particular period of time.
Step 4
Monthly Total User vs New User:
- Compares the total number of users to the number of new users to understand user growth.
- Example: 10,000 Total Users, 2,000 New Users
- Sessions: The time between starting the application and quitting.
- Average Session Duration: The average time spent per user.
- Bounce Rate: The percentage of single-page visits.

Step 5
Monthly Total User vs New User:
- Compares the total number of users to the number of new users to understand user growth.
- Example: 10,000 Total Users, 2,000 New Users


Step 6
Monthly Total User From Traffic Source / Medium:
- Breaks down where the users are coming from google / cpc, google / organic search, bing / organic, social media, facebook, direct.
- Example: 5,000 from Google, 2,000 from Facebook, 3,000 Direct.
Step 6
User by Device Category:
- Breaks down user access by device (desktop, mobile, tablet)
- Example: 6,000 on Desktop, 3,500 on Mobile, 500 on Tablet.


Step 8
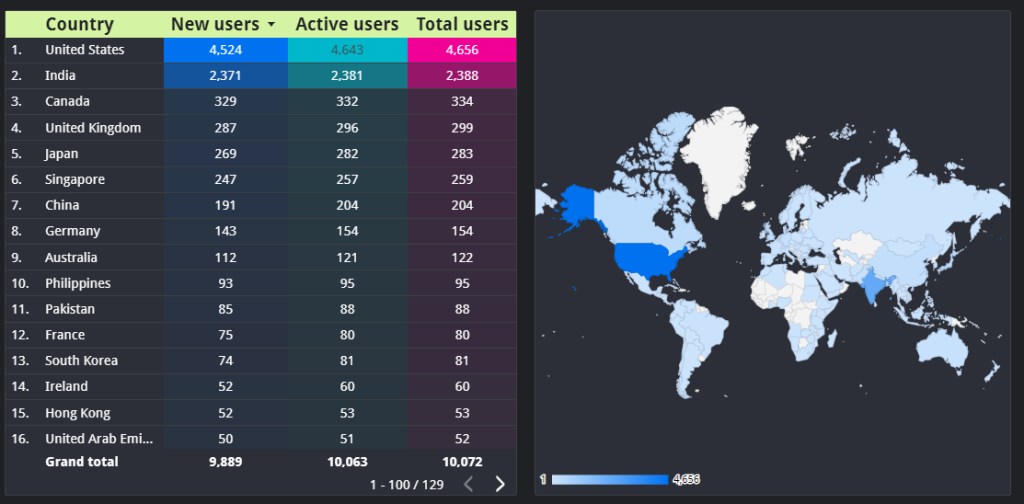
User by Country:
- Provides geographic distribution of users.
- Example: 4,000 from the USA, 2,000 from the UK, 1,500 from Canada
Step 9
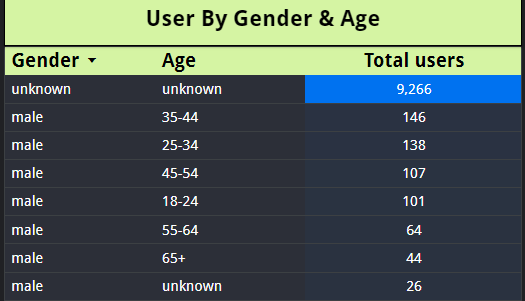
User by Gender and Age:
- Analyzes user demographics to understand the audience better.
- Example: 45% Female (25-34 years), 35% Male (18-24 years)


Step 10
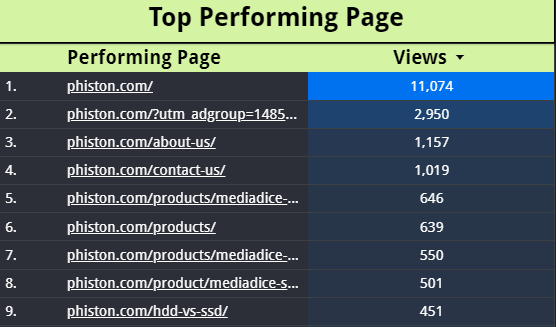
Top Performing Page:
- Highlights the pages with the most views, time spent, or other important metrics.
- Example: Homepage (3,000 views), Product Page (2,500 views), Blog (1,500 views)
