Challenges:
E-Commerce Paradise faced challenges in understanding user behavior on their website and optimizing it for higher conversions. They needed to dig deeper into user actions and engagement to make informed decisions.
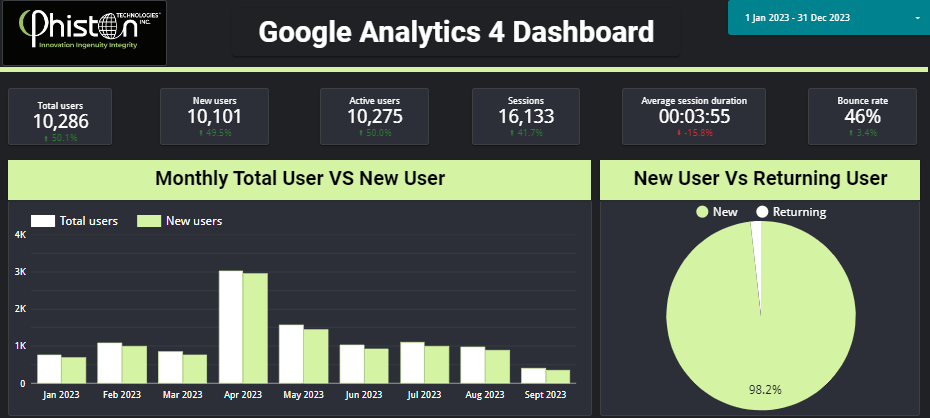
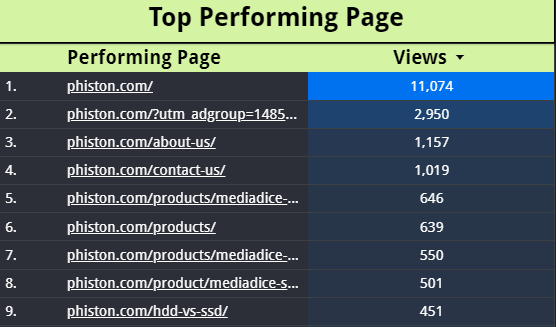
Dashboard Contents: For user overview Looker Studio dashboard use various widgets and visualizations that provide insights info user activity, engagement and other relevant metrics. These include score cards, charts, tables and other graphical representations of data. Below are the general steps to create a Looker Studio user monthly overview report.
Dashboard Contents: For user overview Looker Studio dashboard use various widgets and visualizations that provide insights info user activity,engagement and other relevant metrics. These include score cards, charts, tables and other graphical representations of data. Below are the general steps to create a Looker Studio user monthly overview report.
Step 1
Access and Data Source Connect: Log in to Looker Studio account and connect with GA4 account for data source.
Step 2
Dashboard Template Design:
Create dashboard combines multiple reports into one view. Customize the layout, colors and styling to match company’s branding. Arrange the reports on the dashboard in a logical and visually appealing way. Add controller and set up filters on the dashboard to allow users to select the month or other relevant filters. These controller will enable users to interact with the data on the dashboard.